


Summary
- Twitter’s user growth has been declining, but it still has a strong base of 250+ million active users to monetise.
- Ad revenue per 1,000 impressions is one of the key metrics to watch out for, and as the company drives to improve it, $4.8bn revenue is a possibility in 2016.
- Technology companies, especially software focused, generate 30%-50% EBITDA as the business matures, and hence, Twitter could generate $1.9B EBITDA in 2016.
Objective
We’ll look at Twitter’s (NYSE:TWTR) opportunity in monetising its current user base, relative to Facebook (NASDAQ:FB) and LinkedIn (NYSE:LNKD), and assuming that there is a further slowdown in user growth.
Please note that this is not a complete fundamental analysis of the company, but a look into the revenue opportunity if it can manage to achieve the advertising related metrics of other online companies and the industry.
Limitation of Analysis
Data has been accumulated from different sources, which may have different definitions of metrics, and hence, this analysis should be considered as indicative, and investors should do their own due diligence before making any decisions.
User Growth
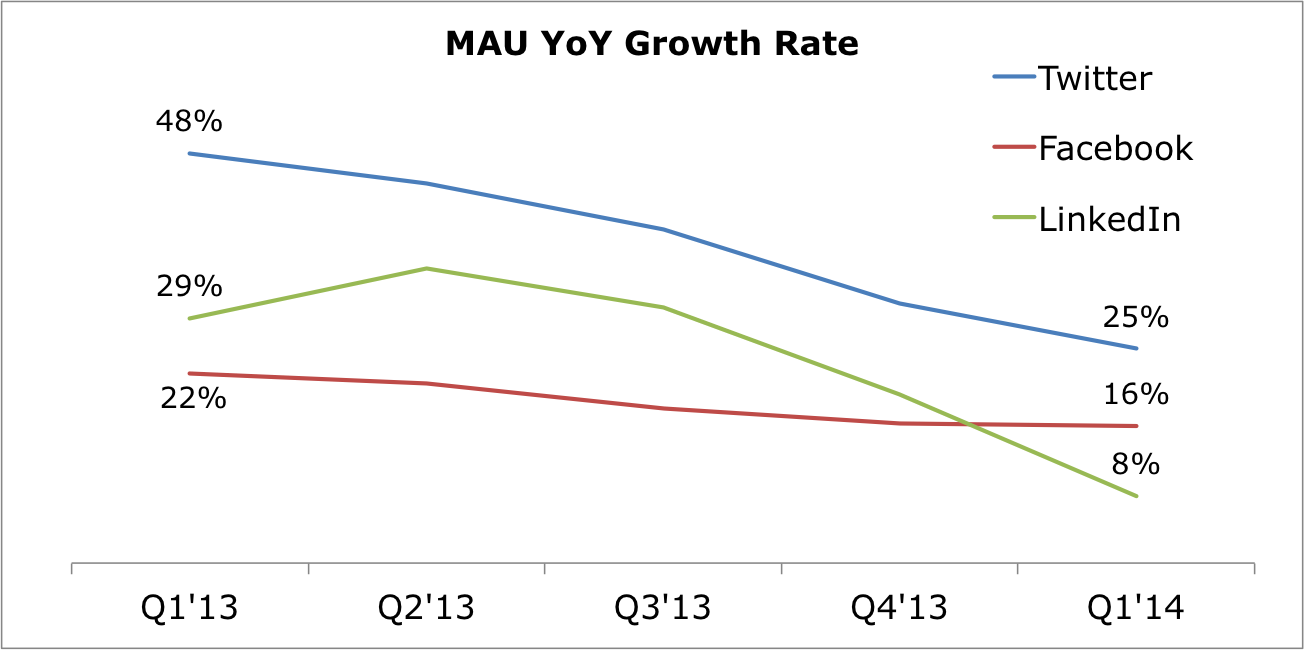
User growth for tech companies has slowed with the slowing growth in internet penetration, from market saturation, and from increased competition for users’ time. As you can see in the chart below, the three giants have seen a dip in YoY growth of users, but do note that Twitter grew the fastest at 25% in Q1’14. This trend is nothing unusual, and happens in every industry when it matures.
Twitter has faced criticism for its less intuitive interface and complicated terminology, which has been a hurdle for a Facebook-like adoption of the service. The company seems to be aware of these issues, which if resolved, could help with the growth in users. The Company in its recent earnings call mentioned about their focus on making the platform more “visually engaging,” organizing content for new users, and innovating on direct messages. I encourage you to open a new Twitter account, and you’ll see how the service handholds new users, and breaks down the “getting started” steps into intuitive ones.
Source: Own Analysis, Published Results.
Absolute User Numbers
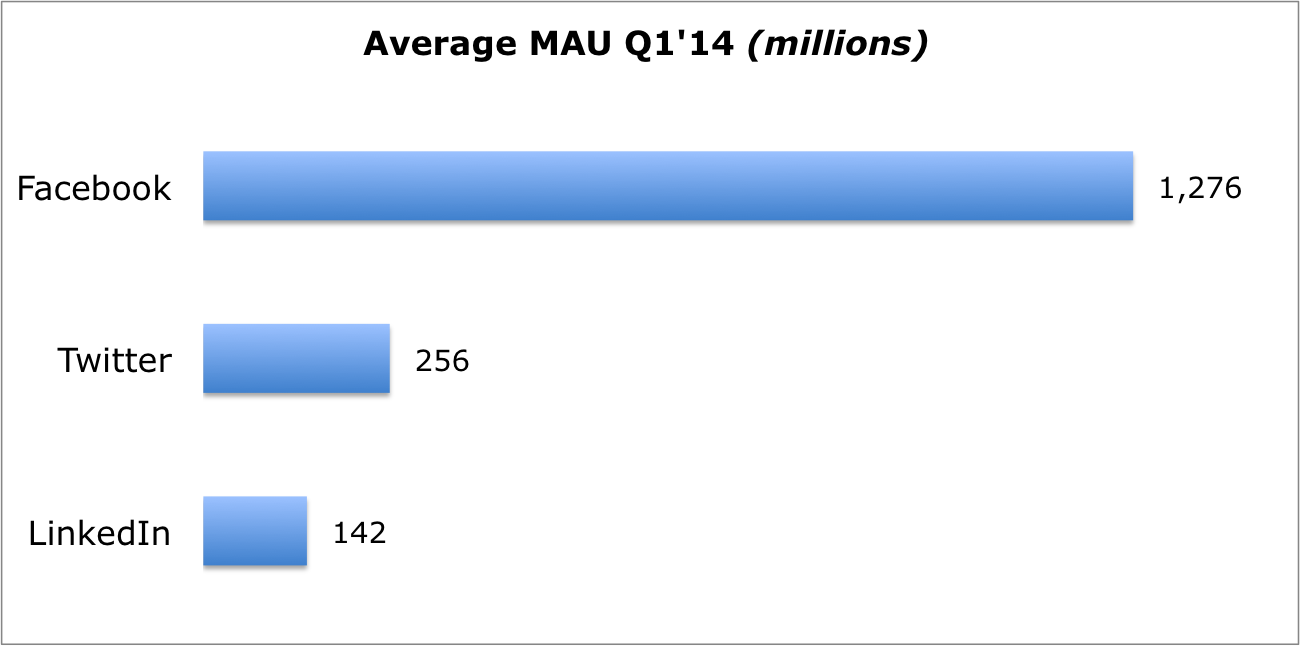
Most companies cannot continue to grow at a rapid pace, especially organically, and what becomes important is whether they have acquired a strong user base to monetize, and to also benefit from economies of scale.
Twitter had more than 250 million monthly active users at the end of last quarter, which I believe is a solid foundation for the company to work from. Twitter has become an indispensable part of several users’ lives, including mine. Stickiness of the service, given the network effects, industry adoption of hashtags, and easy to consume feeds gives it a formidable competitive advantage.
Source: Own Analysis, Published Results.
Note: LinkedIn figures do not include those for SlideShare.
The Revenue Equation
Revenue = Number of Users * Average Revenue Per User (ARPU)
We’ve already looked at users, and now let’s look at ARPU.
ARPU
Facebook and Twitter primarily rely on advertising revenue, while LinkedIn also generates revenue from its “premium subscription” and “talent solutions” services. But, since our primary focus is Twitter, we’ll be looking only at advertising revenue in this article.
When you look at the worldwide annualized ARPU in the chart below, you can see that Twitter’s ARPU is similar to that of LinkedIn’s but only half of that of Facebook.

Source: Own Analysis, Published Results.
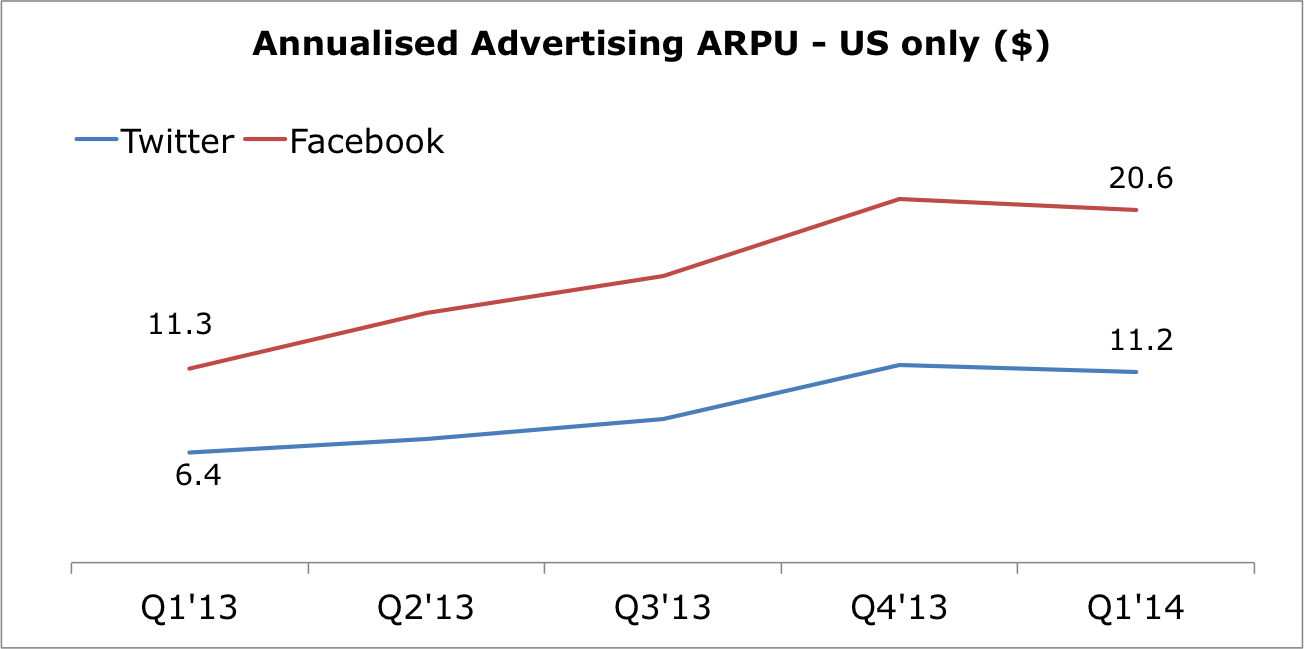
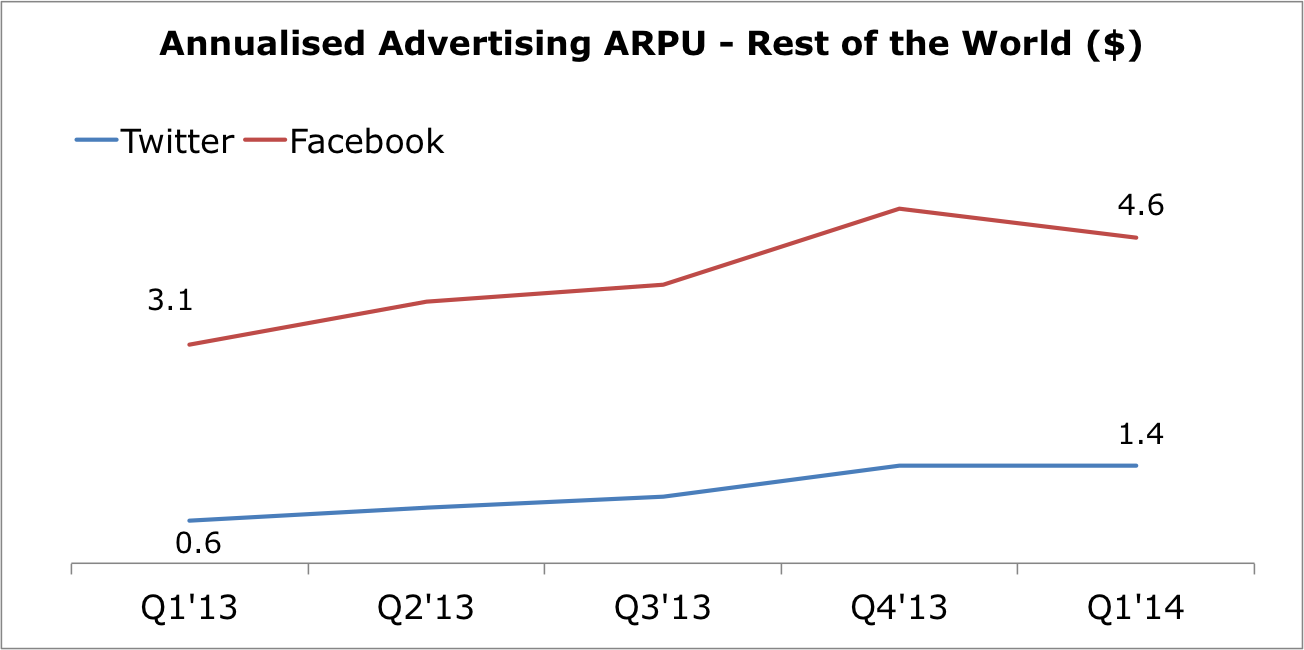
If you further break down the ARPU charts by US and rest of the world (ROW), you can see that Twitter has a bigger gap with Facebook in ROW. Note that LinkedIn does not provide a similar geographical breakdown.
Source: Own Analysis, Published Results.
Source: Own Analysis, Published Results.
The ARPU Equation
It may not be enough to look at ARPU as a whole, and hence we drill down into its components.
Advertising ARPU = Page Views Per User * Advertising Revenue Per Page View
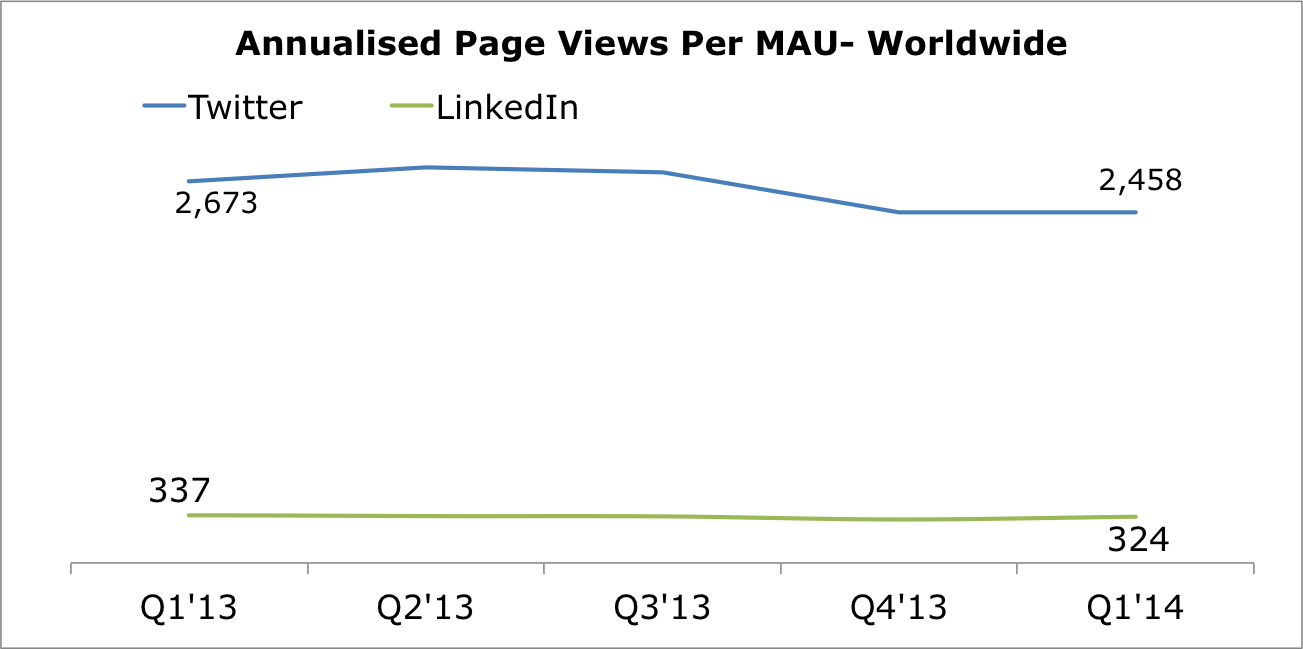
Page Views Per MAU
Twitter had 2,458 annualised page views per user in Q1’14, which works out to seven page views per user per day. LinkedIn page views were expectedly only a fraction of Twitter’s. Unfortunately, I couldn’t find similar data for Facebook.
Source: Own Analysis, Published Results.
The overall trend has been flat to declining, and the story is not very different when you see the breakdown of trends by U.S. only and ROW.
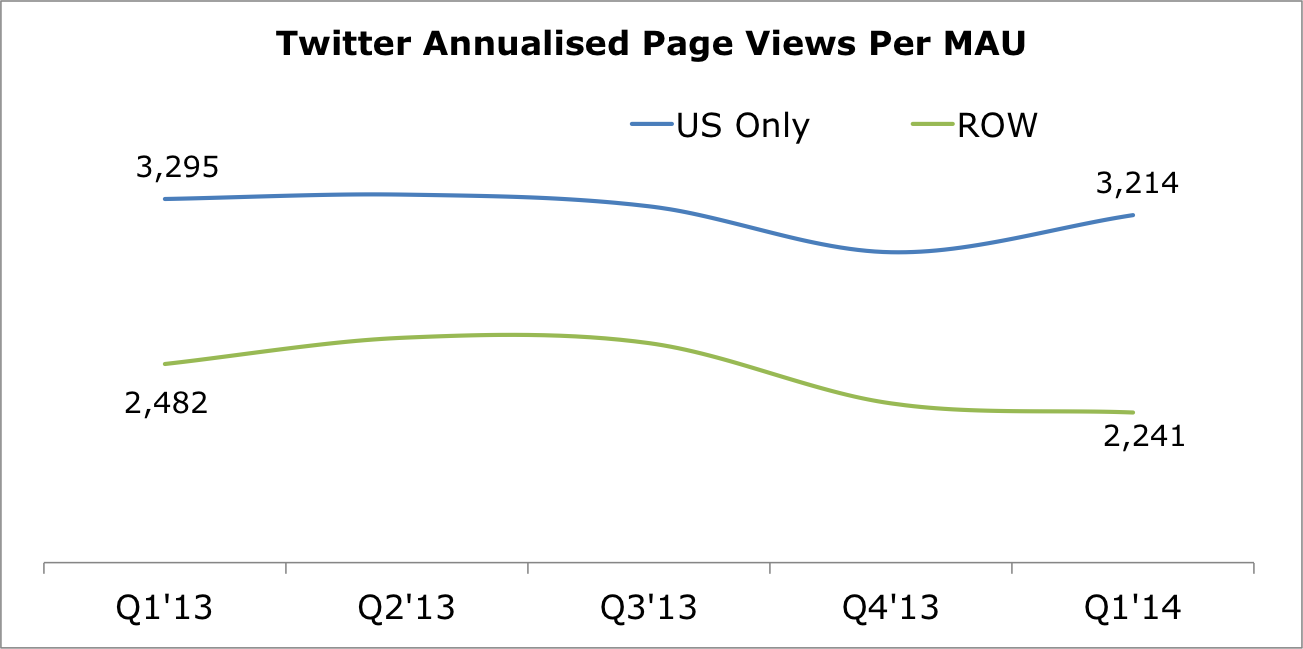
Source: Own Analysis, Published Results.
I do not agree with analysts who think users could churn and adopt other platforms such as Instagram or SnapChat. However, I do agree that as more and more services compete for users’ time, which is limited to X number of hours in a day, it may be a challenge for the company to increase or even maintain the current level of engagement.
For the purposes of the 2016 estimate, given management’s focus on improving engagement, I’ve assumed a modest 2013-16 CAGR of 3% in the U.S. and 10% in ROW.
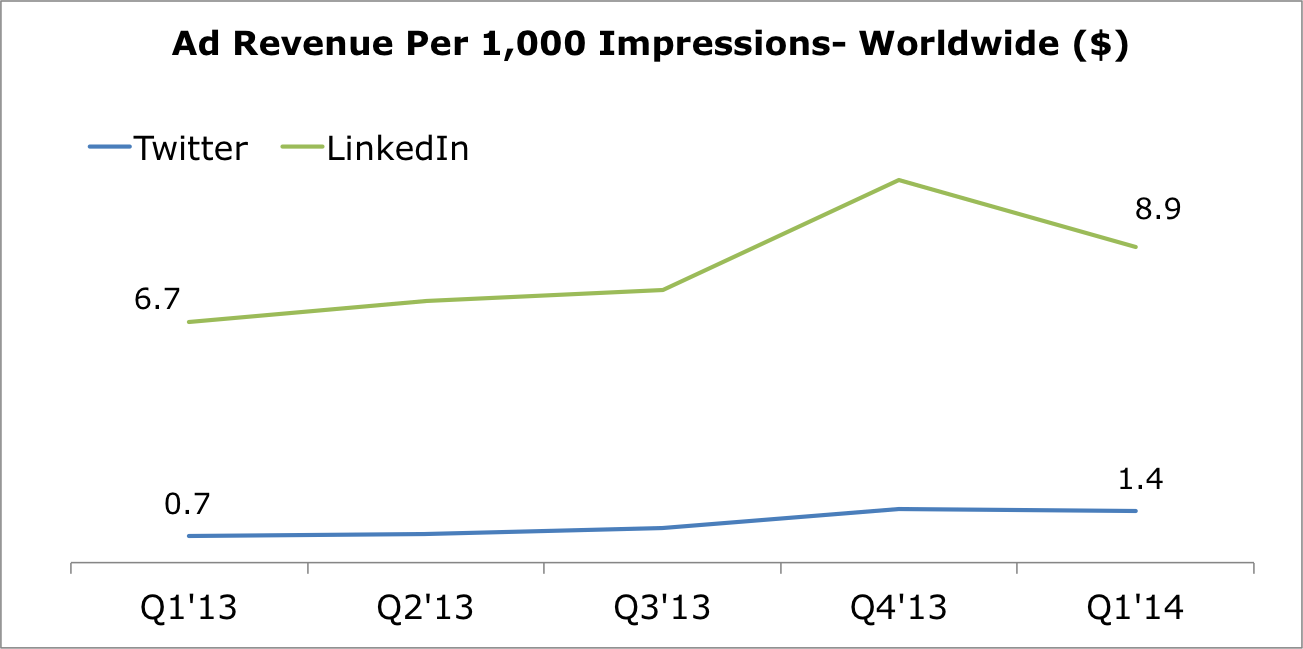
Advertising Revenue Per 1,000 Page Views — RPM
Twitter had a very low RPM of $1.4 in Q1’14, which is a fraction of what LinkedIn earned at $8.9. This may be because:
- The advertising product is still evolving — ad formats, bidding tools, better targeting, tools for advertisers to monitor and improve ROI
- Sales force is still very small, especially outside of the U.S. This is why you see a big gap between the metric for U.S. only and ROW.
- Management’s focus on generating ad revenue “without” deterioration in user experience. They could have bombarded users with adverts, like Facebook does, to significantly increase revenue, but it could have affected the user experience and hence the brand.
Source: Own Analysis, Published Results.
Note: LinkedIn “marketing solutions” is considered to be its advertising, and hence, LinkedIn’s RPM figures may be overstated.
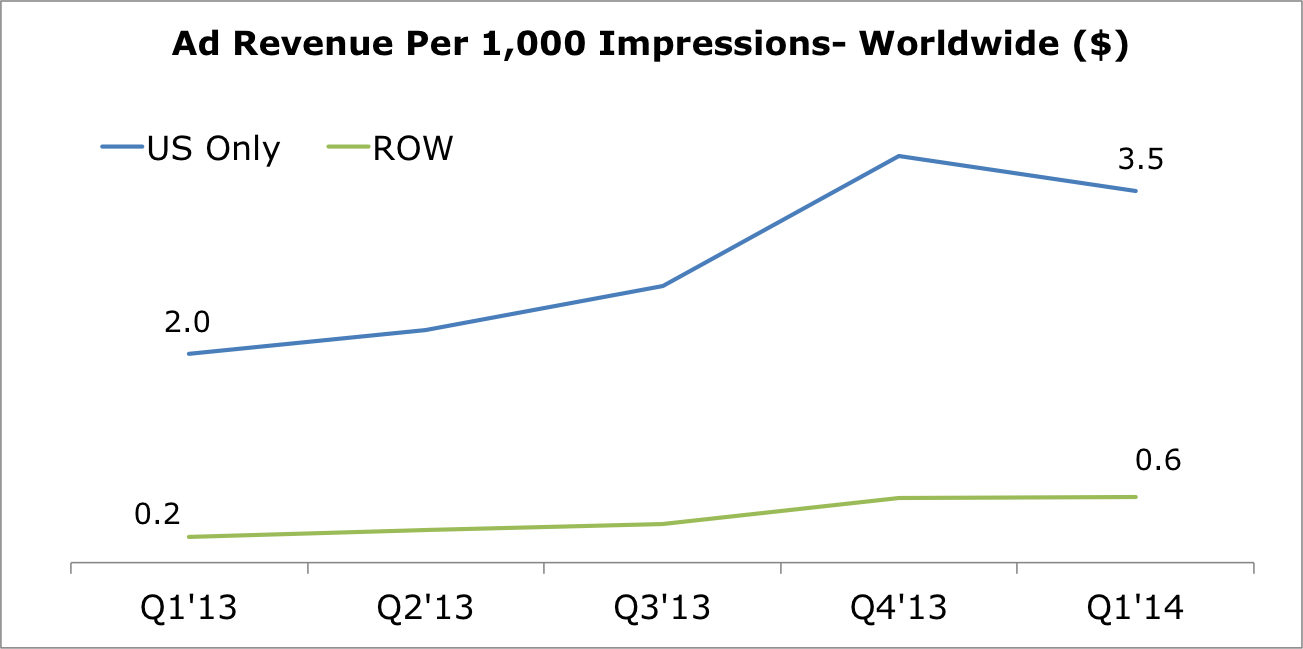
Source: Own Analysis, Published Results.
Management’s focus on growing this metric, especially outside of the U.S., could have a significant impact on the financials of the company. RPM can differ by ad type (text, image, video), relevancy, target audience, demand-supply, etc. Twitter has already started to disrupt communication by becoming the ‘second screen’ service of choice during live events, be it the Oscars or sporting events, and I’m sure management will figure out a way to better monetize these unique opportunities.
Once the company figures out the right combination of ad formats for the service, and provides relevant tools to the advertisers, I can’t see why they couldn’t generate an overall RPM of about $4 with $7 in the U.S., and $3 for ROW.
It’s difficult to find accurate RPM or CPM rates by geography and format, but here is what I could find:
- Youtube: $7.6 in 2013 (Source: Tubemogul)
- Facebook: $0.10 – $6.27 in 2013 depending on ad format (Source: Salesforce)
- Twitter’s CPM seven times higher than Facebook’s (Source: wordstream)
According to AdWeek, “engagement rates” for Twitter ads can be as high as 1%-3%, much higher than Facebook’s average CTR of 0.119%. The benefit for Twitter is that its ads are in-stream, rather than pushed off to the side. However, average CPM (cost per impression) is significantly higher on Twitter, at up to $3.50 compared to an average CPM of $0.59 on Facebook.
Twitter 2016 Revenue Estimates
Below are my high level forecasts based on current trends and my assumptions of future upside. My estimate for 2014 is very similar to the consensus estimate, but I see much higher revenue in 2015 at $2.6B, and in 2016 at $4.8B.
Key assumptions for $5B revenue:
- MAUs: 374 million, 2013-16 CAGR 16% (U.S. 7%, ROW 18%)
- Annualized Page Views Per MAU: 2,098 (8.5 views per user per month), CAGR of 8% (U.S. 3%, ROW 10%)
- RPM: $3.9 (U.S. $6.7, ROW $3.2)
- Derived Annualized ARPU: $12.1 (U.S. $22.2, ROW $9.9) — i.e., $1 per user per month
- Data, licensing, and other revenue continues to grow at a CAGR of 50%

Source: Own Analysis, Published Results, Yahoo Finance.
Revenue Sensitivity Analysis
You may have valid reasons for disagreeing with some of the assumptions in the forecasts above, and so, below is a sensitivity table for two key factors for you to come up with your own revenue estimate.
Revenue figures in the table below are for 2016 and in billions.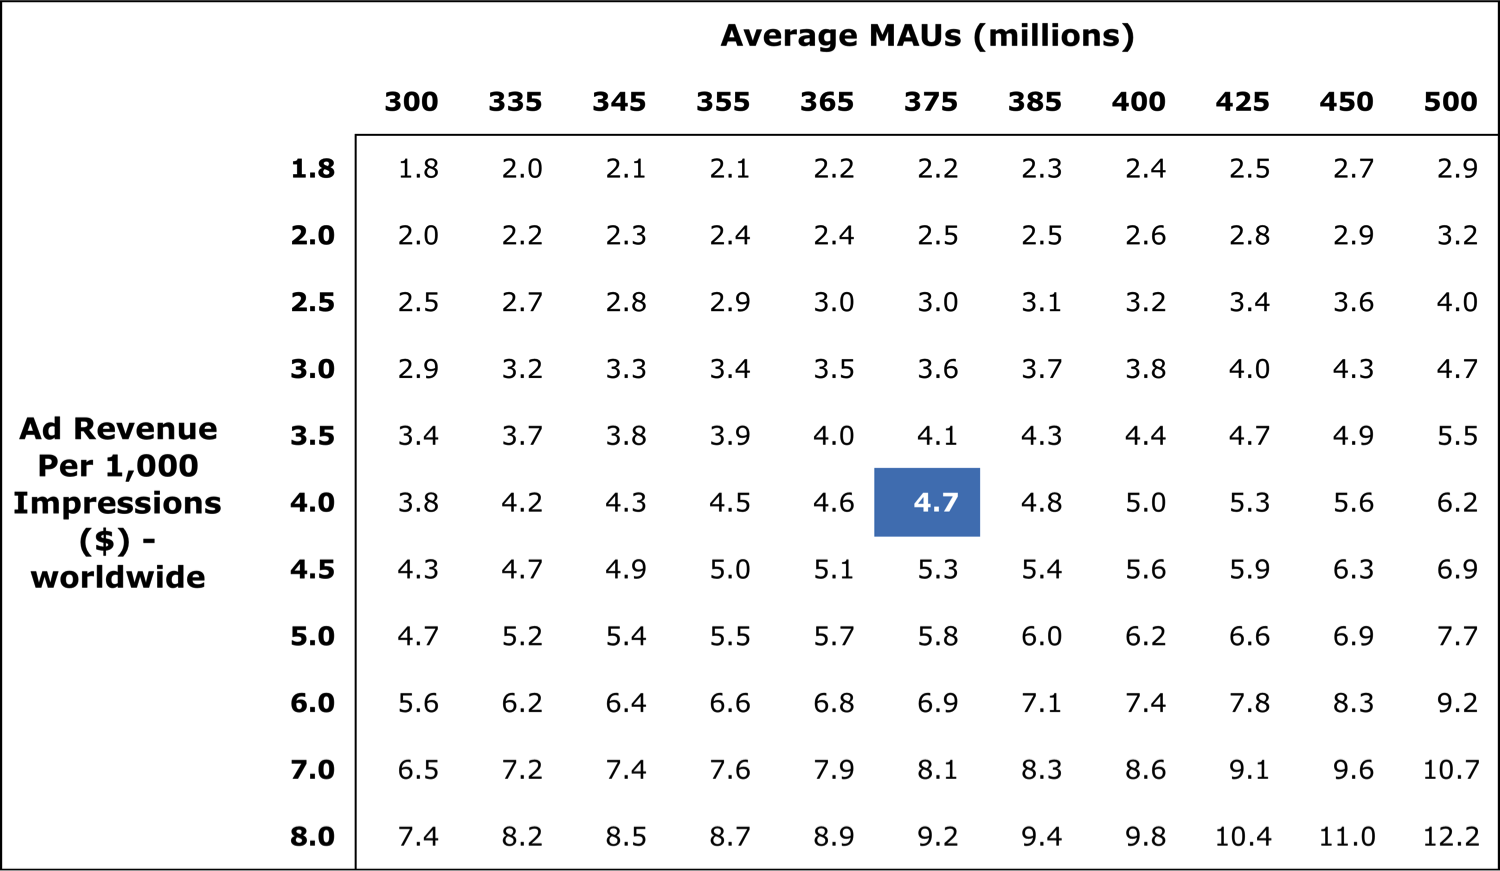
Source: Own Analysis.
EBITDA Margin
Technology companies, as you can see in the chart below, generate 30%-55% EBITDA as their business matures, and they take advantage of economies of scale. Software companies such as Facebook and Microsoft (NASDAQ:MSFT) generate a higher margin compared to companies such as Apple (NASDAQ:AAPL) that also serve hardware. There is no reason why Twitter couldn’t generate a similar margin, and at 40%, it could generate an EBITDA of $1.9B in 2016.
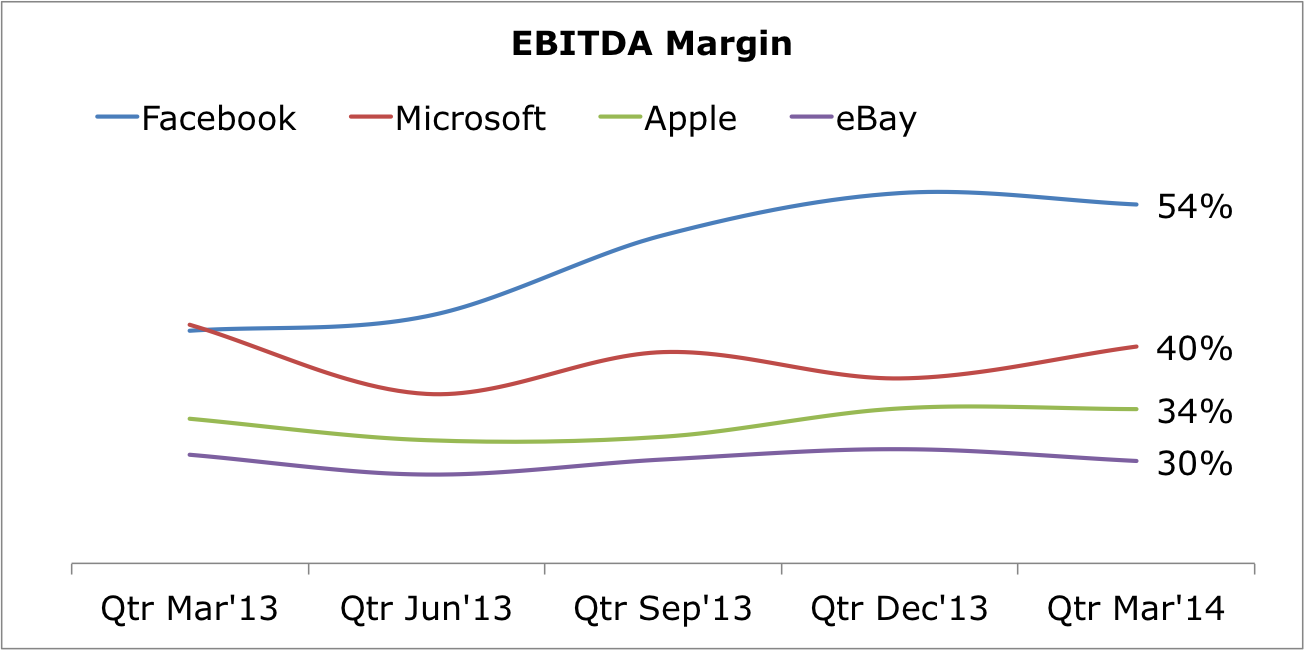
Source: Own analysis, Published Financials.
Conclusion
As management focuses more on monetizing its 250+ million active user base, Twitter could generate $4.8B revenue and $1.9B EBITDA in 2016. At the CMP of 32.44 and market cap of $19B, the company is trading at 10 times 2016 EV/EBITDA, which I think is a reasonable price to pay for a high growth company with a “sticky” product. However, as we’ve seen, it’s a highly volatile stock, and hence, not for the faint of heart.
The financials could be even stronger if they could:
- increase their user base substantially, especially through growth in markets outside the U.S.,
- crack mobile advertising like Facebook did,
- successfully monetise its unique strengths including conversations during live events, and live tweet streams on third party websites,
- offer other services including subscription and licensing, and
- make some smart acquisitions.
Also, as I mentioned in my previous article about the four phases after a tech IPO, Twitter has gone through the “euphoria” phase reaching $75, and is now in the “pessimism” phase. Its price trend when compared to post-IPO performance of Facebook and LinkedIn shows upside potential in the medium term. I’m long Twitter, and will accumulate more if the price falls further.
Disclosure: I am long TWTR, FB. I wrote this article myself, and it expresses my own opinions. I am not receiving compensation for it (other than from Seeking Alpha). I have no business relationship with any company whose stock is mentioned in this article.
Additional disclosure: One of the products of my startup CityFALCON relies on streaming APIs provided by Twitter.
Leave a Reply